
Linking Models to Data: Hypermodels for Science Education
Paul Horwitz
Bolt, Beranek and Newman, Inc.
phorwitz@bbn.com
Abstract
Students today--particularly students in the sciences--are awash in data.
Information floods them from every side. Textbooks outweigh dictionaries,
computers combine with CD-ROM and networking technology to make Hubble
photographs, acid rain figures, and DNA sequences available on every desk
top. But data is useless without structure, facts are meaningless without
conceptual frameworks--information, in short, is not the same as
knowledge. This article introduces a new paradigm for educational
technology--the hypermodel--that seeks to use the computer to bridge the
gap between a model and the physical world the model represents, between
the "facts and figures" offered us by the natural world and the mental
associations we construct to explain them. In the traditional textbook
approach to teaching science the goal is primarily to give students
information. The hypermodel uses a computer to help them turn that
information into knowledge.
An important goal of science education is to influence students to think
like scientists. There is considerable evidence (Chi, Feltovich and
Glaser, 1981) that when professional scientists think about their
discipline they organize experimental data using mental models to link
otherwise disjoint facts, suggest causal relations, expose patterns, and
provide explanations for processes and phenomena. It behooves the science
educator, then, when presenting scientific "facts," to do so in the
context of an appropriately detailed model, and to ensure as far as
possible that students acquire both facts and models in the course of
their learning.
These twin goals-teaching facts and teaching models-are characteristic of
two of the ways in which computers are commonly used in the science
classroom: either as information retrieval devices (treating the
Internet, for instance, as though it were the world's largest CD-ROM) or
else to present models of real-world phenomena in the form of simulations
(Simmons and Lunetta, 1993). But neither of these modes captures the
complex interaction of model and data that characterizes a biologist's
concept of a gene, or a physicist's view of a black hole.
Supported by a grant from the National Science Foundation, my colleagues
and I at Bolt Beranek and Newman, have been implementing and exploring
the use of a new technology we call a "hypermodel" that links the act of
data retrieval to that of model building by coupling representative
real-world data to an underlying model of process. At present this new
technology exists only in the form of a prototype program called GenScope
that is intended to help students learn genetics. Over the next few
years, we plan to enhance this software in significant ways, integrate it
with curricular modules and student activities, and evaluate its effects
both on pedagogy and learning outcomes. Our long term goal is to
demonstrate the educational effectiveness of the hypermodel paradigm as a
complement to the traditional textbook, and to implement the tools,
protocols, and standards necessary to enable other researchers, teachers,
curriculum developers, and students to develop a wide variety of
hypermodels of their own design.
Description of GenScope
Many of the barriers students face when they learn genetics are
consequences of the fact that the phenomena under study take place at
many different levels of description. This multi-layered aspect has made
genetics a rich domain within which to study student problem solving
(Stewart & Van Kirk, 1990). In devising software to help students with
this difficulty, we have considered six such levels: the molecular,
chromosome, cellular, organism, pedigree, and population levels. At each
of these we have devised representations of the information available, as
well as tools for manipulating that information. The information is
shared between the levels, linking them in such a way that the effects of
manipulations made at any one of them may immediately be observed at each
of the others. The levels thus combine to form a seamless environment for
genetic exploration.
Enter the dragons!
To illustrate genetic phenomena the GenScope program starts with a
fictitious species-dragons. These creatures have been given a simple
structure that is useful for teaching purposes and will not prematurely
raise such sensitive issues as the pros and cons of genetic engineering
or the appropriate use of genetic screening tests. Our pedagogical
approach has been to present students with a carefully sequenced set of
problems to solve and then to set them up, two or three to a computer,
and let them work on them. For example, using a model of Mendelian
genetics we may challenge students to create dragons with specific
traits, or to trace a family tree in order to determine the location of a
gene that is responsible for an inherited disease.
Students are generally introduced to GenScope at the organism level (see
figure 1), which displays the organisms' phenotypes (physical traits),
but gives no information at all concerning their genetic makeup. Using a
specific tool, the students may observe a single cell of an organism, as
represented in figure 2. The cell contains chromosomes, made up largely
of DNA molecules that contain all the genetic information carried by the
organism.
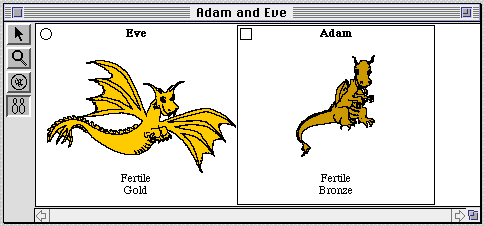
Figure 1. GenScope's organism level. Two organisms are shown-in this
case dragons. Their appearances are determined by their genes, which can
be viewed and altered by the students.
The cells represented on the computer can be made to undergo either
mitosis, simple replication, or meiosis, in which process they produce a
new kind of cell, called a gamete, which possesses only a randomly
selected half of the chromosomes of the parent cell. Once formed, the
gametes can be combined in the central panel of the cell window, to
produce a fertilized cell, or zygote, containing the usual complement of
chromosomes. The zygote, in turn, will grow into a dragon possessing
genetic material inherited from each of its parents. Meiosis is
particularly difficult for students to understand, in part because
although it is a cellular process, it involves processes that take place
at the chromosomal and molecular levels, and its effects are felt at the
pedigree and population levels.
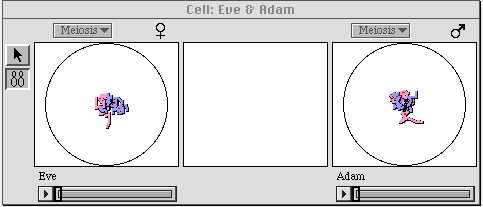
Figure 2. The cellular level of GenScope. Shown are one cell each
from Eve and Adam, the two dragons depicted in figure 1. The
spaghetti-looking things in the centers of the cells are chromosomes, the
carriers of the genetic information within the cell. These cells can be
made to undergo meiosis (division into four gametes, each of which
contains only half the genetic material of the parent cell) or mitosis
(ordinary cell division into two identical cells. When meiosis is evoked,
the computer runs a randomized simulation of gamete formation, as shown
below in figure 3.
Thus, it is central to the field of genetics and a good deal of attention
has been paid to it in the science education research literature
(Kindfield, 1994; Liberatore Cavallo, A & Schafer, L, 1994).
Meiosis is represented graphically in the form of a computer animation,
as shown in figures 2 and 3. The animation does not, however, attempt to
represent the full complexity of the process, nor does it look exactly
like meiosis as it appears under a microscope.
The role of the hypermodel
It is good for students to learn about meiosis by looking at a computer
animation, but it is also important for them to know what a real cell
looks like under a microscope, and how it divides. It is vital for them
to realize that the real world is not as simple as a computer
representation, that the information one seeks is often obscured by
confusing and extraneous evidence, that interpretation of data is
generally not as straightforward as it may appear in textbooks or in
carefully arranged classroom experiments.
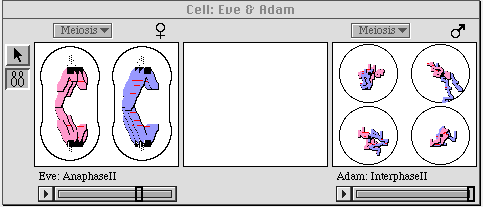
Figure 3. Meiosis is in process in this snapshot of the cell window.
Adam's cell, on the right, has already produced the four gametes; Eve's
cell, on the left, has completed the first division and is halfway
through the second.
Most high school biology laboratories have at least one microscope, and
it is possible-and advisable-for students to use this to view cells. But
it is nearly impossible to set things up in a classroom so that one can
watch an actual meiosis-for one thing, the process takes too long, for
another it is very difficult to observe under any but optimal conditions.
So it is educationally valuable to store a short movie sequence of this
process on a CD-ROM and let students view it on a computer. Indeed, this
kind of thing is becoming so common in educational software that a new
name has been coined to describe it: multimedia.
What a hypermodel can do, however, that is not attempted by the
conventional multimedia packages is to link a movie of cell division to a
computer model of the same process, as depicted in figure 4. On the
left-hand side of the window is a QuickTime movie of a cell undergoing
meiosis. The process is at the stage known technically as "anaphase I."
In the righthand pane of the window is the computer model's version of
the same thing. As the student manipulates the scroll bar underneath the
movie, both the movie and the model move through the various
phases of the process.
The model is not just a "cartoon" version of the movie; it still retains
all its former functionality. For one thing, it is a random process-the
chromosomes migrate to different gametes each time it is run and their
genetic material may be shared in another random process called
"crossover." Furthermore, each model chromosome can be examined in
greater detail, its genes and its DNA can be observed and altered as
described below. The computer model, in other words, is a live,
manipulable object, whereas the movie is stored data-static and
immutable. The one represents the mental model we want the student to
construct, the latter is the bedrock data that the model must explain.
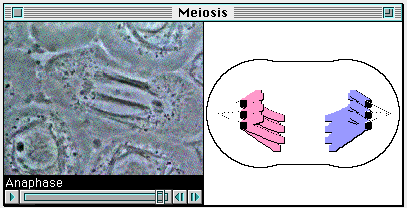
Figure 4. Linking of computer model of meiosis to a stop-action movie
of the process as observed under a microscope. The QuickTime movie
actually controls the computer model by sending it commands that cause it
to go into different states. The full functionality of the model is
retained, however, including the randomness of the inherent in the
process.
Biological structure and information content
At the cellular level, GenScope represents chromosomes as they appear in
nature-as squiggly "spaghetti strands" in the nuclei of cells. But the
importance to genetics of these biological structures stems from their
role as carriers of information, and for this reason they are often
depicted in textbooks as stylized rectangles with positions marked on
them representing the locations of various genes. GenScope incorporates
this representation as well, but with two important differences: the
genes so marked may be altered by the student, producing corresponding
alterations in the organism itself, and the chromosomes may be "opened
up" to reveal the underlying structure of genes as sequences of DNA.
In figure 5, for example, we see GenScope's version of the textbook
depiction of a pair of chromosomes as rectangular objects, schematically
representing the linear DNA molecule, with the genes marked at their
respective locations. However, anyone familiar with the Macintosh
interface will notice that the labels marking the genes are actually
pulldown menus. Activating these enables the student to change the gene
from one variant, or "allele," to another. Such changes are accompanied
by changes in the appearance of the organism to which the genes belong,
as appropriate. Thus, an alteration of the wings gene in chromosome 2b,
below, from the "W+" form to the "w" form will cause the wings on the
dragon to disappear. We have observed students to figure out for
themselves the classical Mendelian rules governing the behavior of
dominant, recessive, and co-dominant alleles simply by playing around in
this way with the various genes. In fact, the dragon genome as we have
constructed it includes such relatively advanced topics as sex-linked
traits, polygenicity (wherein a trait is affected by more than one gene),
and pleiotropy (the opposite condition, in which more than one trait is
affected by the same gene).
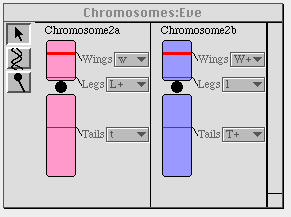
Figure 5. The "informational" representation of a pair of
chromosomes. Note that the labels on the genes are pulldown menus, which
allows students to change them and view the alterations, if any, in the
affected organism.
Seen at the chromosome level, as above, genes are simply "markers" of
some kind-their exact nature remains as mysterious to students as it was
to Mendel and his colleagues. The true nature of the genetic mechanism
resides, as we now know, at the molecular level, and GenScope enables
students to drop down to this level to explore the DNA molecule that is
contained within each chromosome. Figure 5 shows Eve's two genes for
wings, for instance, showing what the "W+" and "w" alleles look like at
the DNA level. They differ, but only very slightly. See if you can
discover the difference between them1.
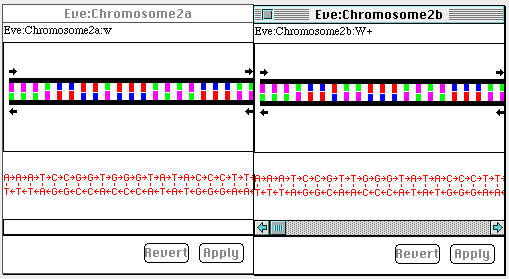
Figure 6. The DNA level representation of the two forms of the gene
for wings. The left window shows the dominant and wild type (normally
found in the population)W+ allele, the right window the recessive w
allele. They differ by a point mutation-a single base pair
substitution.
The DNA level has two complementary representations: a physical
representation that shows the molecule as strings of colored rectangles
representing the base pairs strung out in a linear array, and an
informational representation in which the bases are displayed as a linear
sequence of the letters ATGC, the initial letters of their names:
adenine, thymine, guanine, and cytosine. The tension between representing
biological reality and emphasizing information content is reminiscent of
the contrast between "chromosome as spaghetti" and "chromosome as
rectangle" presented above, and indeed it permeates the GenScope program
throughout.
Just as the informational representation of a gene can be manipulated,
via pulldown menus, so the equivalent representation of a DNA molecule
can also be altered, simply be deleting or inserting the appropriate
letters, typing them in as one would with a word processor. In this way,
alleles can be altered at the DNA level and the changes will be reflected
in the organism just as though the gene had been altered directly on the
chromosome. using the pulldown menu. Mutations created at the DNA level
are treated as new alleles. They can be named and used just as the
pre-defined ones can. (Their default effect is to mimic the recessive
allele, but GenScope includes pre-programmed mutations that cause, among
other things, albinism.)
Dragon DNA is purposely designed to be as simple as possible, while still
illustrating certain central points. GenScope, however, can also
represent other species, and when it does so the DNA can be derived from
actual sequencing data. We have done this in a few cases, most notably
the representing the normal and sickle cell alleles of the human
hemoglobin beta gene. This is another example of the close connection
between GenScope's internal model of genetics and real-world data.
Eventually, we plan to replace all fictitious DNA by the real thing
wherever the sequence information is known.
Pedigrees and populations
As we have seen, organisms can be mated by combining gametes at the
cellular level to produce a fertilized zygote. The resulting offspring
will exhibit the traits appropriate to the particular mix of alleles it
has inherited from the parents. This process is somewhat laborious
(though instructive) and produces only one offspring at a time. For
statistically oriented studies of inheritance patterns GenScope's
pedigree level is considerably more useful (see figure 6). This is also
the logical level for the introduction of genetics puzzles involving
probability theory.
At this level female organisms are represented by circles, males by
squares. A single phenotype, selectable by the user, can be represented
schematically by full or partial filling of the icon representing the
organism. Any two organisms of opposite sex may be mated, or "crossed,"
to produce a preset number of offspring. The genotypes (the set of
alleles), and therefore the phenotypes (physical traits), of these
offspring are randomly inherited from the parents.
The organisms represented on a pedigree are as "real" as those created at
the organism level or "grown" through fertilization. Their chromosomes
and DNA can be examined in just the same way, and they can even be
dragged with the mouse onto the organism level, where they are displayed
in the same way as any other organism.
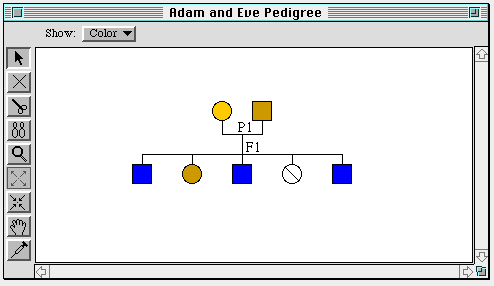
Figure 7. The pedigree level. Note that one of Adam and Eve's
daughters is stillborn, due to a sex-linked lethal gene.
At the population level, GenScope represents organisms by smaller circles
and squares, which once again can be made to show a particular phenotype.
This level introduces time and space, however-the organisms can be made
to move about on the screen, randomly mating with each other. Moreover,
different portions of the screen can be assigned different
"environments," which selectively favor one or another phenotype. Thus,
for example, we can create a "mountainous" area that favors the survival
of winged dragons (presumably because they don't fall off cliffs so
easily) and a "swamp" that favors dragons with no legs (because they swim
better). When we run a population of animals with randomly chosen genes
through many generations we find evidence of "genetic drift" which causes
wings to predominate in the mountains, while "snakes" flourish in the
swamp.
Organisms at the population level are treated in the same way as at any
other. In particular, the cell and chromosome tools work at this level
just as they do at the organism and pedigree levels. The organisms
themselves can be dragged onto the other two levels, as well, where they
are represented in the same way as organisms that were "grown" there.
This is particularly useful in the case of the pedigree window, because
it enables one to see how a particular trait "arises" in a population. By
dragging an organism that possesses the characteristic of interest onto
the pedigree window, the user can examine all of its ancestors and can
easily trace any allele from one generation to the next.
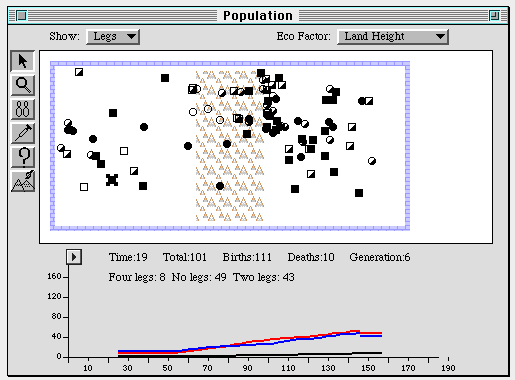
Figure 8. The population level. Filled squares and circles represent
dragons with no legs, partially filled have two legs, and the unfilled
ones have four. The graph depicts the growth of these three
subpopulations over 6 generations under conditions of random mating. The
mountain range down the center of the window has no effect on fitness in
this simulation.
III. Other Uses of Hypermodels
GenScope is still "under construction" and does not yet make full use of
its ability to link its model to stored information. At this writing we
have applied our model to three species: in addition to the fictitious
dragons we have created files for humans and fruitflies (drosophila
Melanogaster). Clearly, these real species, as well as the many others
that we plan to add in the near future, offer excellent opportunities for
linking visual data to GenScope in the form either of stills or of short
movies that illustrate the various phenotypes. The molecular level, too,
cries out for connections to real-world phenomena. In addition to
electron microscope pictures of molecular phenomena, video clips of
laboratory procedures for isolating, purifying, and sequencing DNA could
be linked to the GenScope model, offering students an introduction to
biotechnology while at the same time emphasizing the indirect nature of
experimental data and the complex chain of inference underlying most
scientific models.
It is all too easy, in studying the science of genetics, to lose sight of
its human dimension. As the Human Genome Project vividly demonstrates,
advances in locating and identifying human genes can have unexpected and
sometimes soul wrenching consequences for individuals who are at risk of
acquiring or transmitting genetically inherited diseases. Decisions with
respect to genetic screening-for oneself, one's parents, one's mate,
one's unborn offspring-are portentous and fraught with uncertainty and
fear. Informed judgments often differ markedly as to what tests should be
performed and who should be privy to the results. The ethical, social,
and moral dilemmas brought about by advances in human genetics cannot be
"solved" by science alone, but they arise in a scientific context and are
affected by scientific judgment and fact.
A hypermodel can help to illuminate and guide discussion of social and
ethical issues by embedding model-based exploratory activities within a
real-world context. For example, to illustrate the dilemmas caused by
advances in identifying the gene responsible for, say, Huntington's
disease, we might link GenScope's internal model to a set of video clips
of real people (or actors) who suffer from the disease, or are at risk of
developing it or handing it down to their offspring. Connecting such a
video to a realistic and manipulable model can serve not only to
demonstrate the power of the science, but to aid young people to grapple
with difficult moral decisions in a safe and informative context. In this
way we may perhaps approach a "holy grail" of science education-placing
complex scientific subject matter in a broader societal context without
trivializing either.
References
Chi, M., Feltovich, P., & Glaser, R. (1981), Categorization and
representation of physics problems by experts and novices. Cognitive
Science, 5, 121-152.
Liberatore Cavallo, A. & Schafer, L. (1994), Relationships between
students' meaningful learning orientation and their understanding of
genetics topics. Journal of Research in Science Teaching, 31(4),
393-418.
Kindfield, A. (1994) Understanding a basic biological process: expert and
novice models of meiosis, Science Education 78(3), 255-283.
Simmons, P. & Lunetta, V. (1993), Problem-solving behaviors during a
genetics computer simulation: beyond the expert/novice dichotomy.
Journal of Research in Science Teaching, 10, 153-173.
Stewart, J. & Van Kirk, J., Understanding and problem-solving in
classical genetics. Journal of Science Education, 12 (5), 575-588.
|


