| Comprehensive site analysis report |
| This report shows detailed information to give you an in-depth look at the activity on your web site. This report requires "IP resolution", "Title lookups", and "Whois queries" to be completed before analysis. |
| 1. Overview | 5. Referring organization summary |
| 2. User organization and geography | 6. Browser summary |
| 3. Request summary | 7. Bandwidth summary |
| 4. Visit summary | 8. Definitions |
| Overview |
| General activity statistics |
| Number of hits | 16,243,793 |
| Number of requests | 2,057,681 |
| Number of visits | 812,322 |
| Average number of requests per visit | 2.53 |
| Average visit duration | 00:01:31 |
| User organization and geography |
| Organization breakdown |
| Number of organizations | 38,351 |
| Number of U.S. organizations | 10,035 |
| Number of Canadian organizations | 581 |
| Number of International organizations | 2,152 |
| Number of unknown organizations | 25,583 |
| Top 15 U.S. cities |
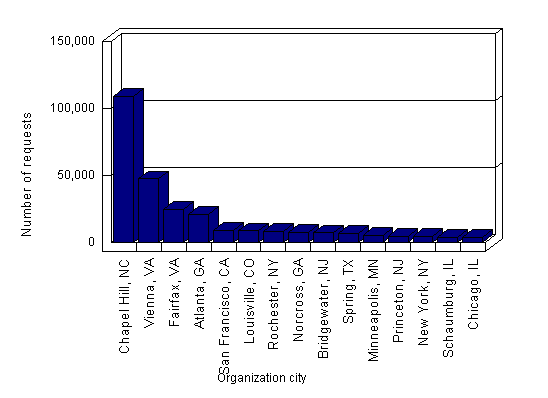 |
| Organization city | Number of requests | |
| 1. | Chapel Hill, NC | 109,009 |
| 2. | Vienna, VA | 47,256 |
| 3. | Fairfax, VA | 24,688 |
| 4. | Atlanta, GA | 21,002 |
| 5. | San Francisco, CA | 8,688 |
| 6. | Louisville, CO | 8,552 |
| 7. | Rochester, NY | 8,232 |
| 8. | Norcross, GA | 7,592 |
| 9. | Bridgewater, NJ | 7,159 |
| 10. | Spring, TX | 6,526 |
| 11. | Minneapolis, MN | 5,142 |
| 12. | Princeton, NJ | 4,662 |
| 13. | New York, NY | 4,647 |
| 14. | Schaumburg, IL | 3,917 |
| 15. | Chicago, IL | 3,593 |
| Total | 270,665 |
| Top 10 U.S. organizations |
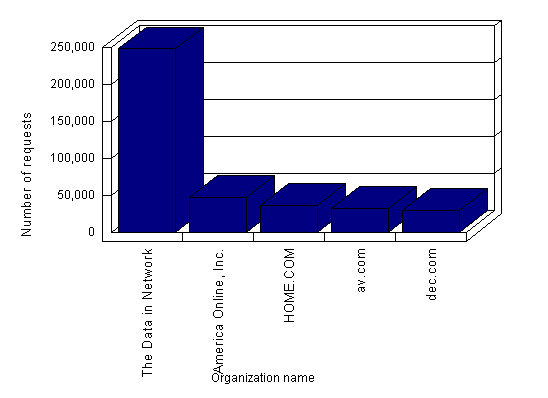 |
| Organization name | Number of requests | % of U.S. requests | |
| 1. | The Data in Network Solutions' WHOIS database is provided by NetworkSo | 248,077 | 23.82% |
| 2. | America Online, Inc. | 46,856 | 4.50% |
| 3. | HOME.COM | 36,882 | 3.54% |
| 4. | av.com | 32,080 | 3.08% |
| 5. | dec.com | 30,093 | 2.89% |
| Total | 393,988 | 37.83% |
| U.S. requests by organization type |
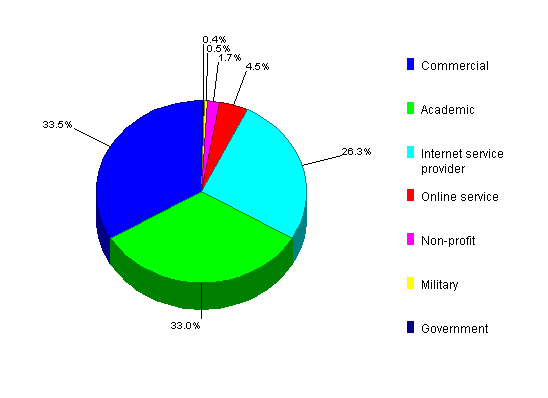 |
| Top 15 U.S. organizations by organization type |
| Lists visits by U.S. organization type (e.g. commercial, education, and military) and lists the top 15 organizations within each type. Determine if your target customers are visiting your site as frequently as expected or learn about new organization names or types to target |
|
Organization type Organization name |
Number of requests | % of U.S. requests |
| Commercial | ||
| The Data in Network Solutions' WHOIS database is provided by NetworkSo | 168,708 | 16.20% | HOME.COM | 36,882 | 3.54% | av.com | 32,080 | 3.08% | dec.com | 30,093 | 2.89% | adcore.com | 8,856 | 0.85% | WEBTOP.COM | 4,540 | 0.44% | ntl.com | 4,082 | 0.39% | NORTHERNLIGHT.COM | 3,805 | 0.37% | netsetter.com | 1,371 | 0.13% | dtgnet.com | 1,061 | 0.10% | petersnews.com | 988 | 0.09% | cox-internet.com | 986 | 0.09% | francistuttle.com | 929 | 0.09% | bbnplanet.com | 791 | 0.08% | DIRECTHIT.COM | 745 | 0.07% |
| Subtotal (Commercial) | 295,917 | 28.41% | Academic |
| The Data in Network Solutions' WHOIS database is provided by NetworkSo | 300,370 | 28.84% | westernu.edu | 5,338 | 0.51% | IASTATE.EDU | 1,813 | 0.17% | MAINE.EDU | 1,665 | 0.16% | maricopa.edu | 1,330 | 0.13% | NYU.EDU | 1,169 | 0.11% | OKSTATE.EDU | 1,132 | 0.11% | NODAK.EDU | 1,111 | 0.11% | OHIO-STATE.EDU | 1,078 | 0.10% | firn.edu | 1,046 | 0.10% | DUKE.EDU | 844 | 0.08% | ODU.EDU | 726 | 0.07% | FULLERTON.EDU | 707 | 0.07% | davenport.edu | 657 | 0.06% | drexel.edu | 637 | 0.06% |
| Subtotal (Academic) | 319,623 | 30.69% | Internet service provider |
| The Data in Network Solutions' WHOIS database is provided by NetworkSo | 197,244 | 18.94% | dialsprint.net | 4,297 | 0.41% | dialinx.net | 3,779 | 0.36% | OPTONLINE.NET | 3,442 | 0.33% | gtei.net | 3,216 | 0.31% | grid.net | 2,777 | 0.27% | navipath.net | 2,563 | 0.25% | shawcable.net | 2,464 | 0.24% | mich.net | 2,234 | 0.21% | above.net | 2,138 | 0.21% | telus.net | 2,095 | 0.20% | eircom.net | 1,243 | 0.12% | ena.net | 1,186 | 0.11% | flashcom.net | 993 | 0.10% | sprintbbd.net | 974 | 0.09% |
| Subtotal (Internet service provider) | 230,645 | 22.14% | Online service |
| America Online, Inc. | 46,856 | 4.50% | NETCOM | 338 | 0.03% |
| Subtotal (Online service) | 47,194 | 4.53% | Non-profit |
| The Data in Network Solutions' WHOIS database is provided by NetworkSo | 7,076 | 0.68% | ESU3.ORG | 653 | 0.06% | panesu.org | 297 | 0.03% | hisd.org | 272 | 0.03% | mahaska.org | 266 | 0.03% | esu6.org | 241 | 0.02% | ESU2.ORG | 192 | 0.02% | NEA.ORG | 168 | 0.02% | CNYRIC.ORG | 162 | 0.02% | affinityhealth.org | 138 | 0.01% | LHRIC.ORG | 112 | 0.01% | EDC.ORG | 109 | 0.01% | salemcc.org | 108 | 0.01% | hccanet.org | 96 | 0.01% | ops.org | 93 | 0.01% |
| Subtotal (Non-profit) | 9,983 | 0.96% | Military |
| NIPR.MIL | 1,920 | 0.18% | NAVY.MIL | 1,049 | 0.10% | ARMY.MIL | 1,013 | 0.10% | af.mil | 778 | 0.07% | dsm.mil | 116 | 0.01% | usmc.mil | 107 | 0.01% | uscg.mil | 87 | 0.01% | soc.mil | 66 | 0.01% | ncsc.mil | 54 | 0.01% | dla.mil | 44 | 0.00% | osd.mil | 42 | 0.00% | dss.mil | 38 | 0.00% | nima.mil | 35 | 0.00% | nosc.mil | 24 | 0.00% | disa.mil | 18 | 0.00% |
| Subtotal (Military) | 5,391 | 0.52% | Government |
| The Data in Network Solutions' WHOIS database is provided by NetworkSo | 2,854 | 0.27% | fernald.gov | 202 | 0.02% | ED.GOV | 197 | 0.02% | epa.gov | 139 | 0.01% | NIST.GOV | 120 | 0.01% | gsa.gov | 102 | 0.01% | NIH.GOV | 95 | 0.01% | osis.gov | 68 | 0.01% | opm.gov | 55 | 0.01% | ohio.gov | 51 | 0.00% | fda.gov | 48 | 0.00% | noaa.gov | 40 | 0.00% | faa.gov | 37 | 0.00% | nrc.gov | 32 | 0.00% | FCC.GOV | 30 | 0.00% |
| Subtotal (Government) | 4,070 | 0.39% |
| Total (Organization types) | 912,823 | 87.64% |
| Top 10 Canadian organizations |
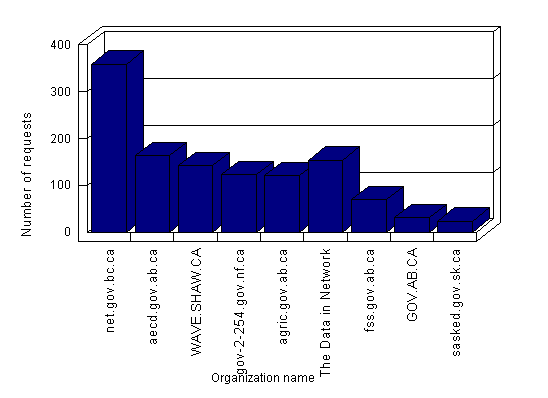 |
| Organization name | Number of requests | % of Canadian requests | |
| 1. | net.gov.bc.ca | 359 | 26.93% |
| 2. | aecd.gov.ab.ca | 163 | 12.23% |
| 3. | WAVE.SHAW.CA | 142 | 10.65% |
| 4. | gov-2-254.gov.nf.ca | 123 | 9.23% |
| 5. | agric.gov.ab.ca | 121 | 9.08% |
| 6. | The Data in Network Solutions' WHOIS database is provided by NetworkSo | 154 | 11.55% |
| 7. | fss.gov.ab.ca | 70 | 5.25% |
| 8. | GOV.AB.CA | 31 | 2.33% |
| 9. | sasked.gov.sk.ca | 24 | 1.80% |
| Total | 1,187 | 89.05% |
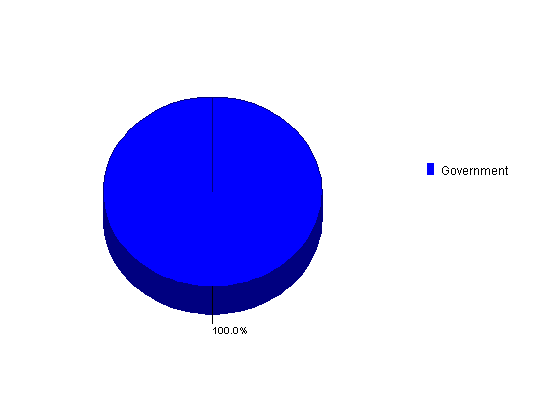
| Canadian requests by organization type |
 |
| Top 15 Canadian organizations by organization type |
| Lists visits by Canadian organization type (e.g. commercial, education, and military) and lists the top 15 organizations within each type. Determine if you're target customers are visiting your site as frequently as expected or learn about new organization names or types to target. |
|
Organization type Organization name |
Number of requests | % of Canadian requests | |
| 1. | Government | ||
| net.gov.bc.ca | 359 | 26.93% | |
| The Data in Network Solutions' WHOIS database is provided by NetworkSo | 196 | 14.70% | |
| aecd.gov.ab.ca | 163 | 12.23% | |
| WAVE.SHAW.CA | 142 | 10.65% | |
| gov-2-254.gov.nf.ca | 123 | 9.23% | |
| agric.gov.ab.ca | 121 | 9.08% | |
| fss.gov.ab.ca | 70 | 5.25% | |
| GOV.AB.CA | 31 | 2.33% | |
| sasked.gov.sk.ca | 24 | 1.80% | |
| GOV.NF.CA | 23 | 1.73% | |
| mcf.gov.bc.ca | 14 | 1.05% | |
| cd.gov.ab.ca | 12 | 0.90% | |
| GOV.YK.CA | 8 | 0.60% | |
| EDUC-39-161.gov.nt.ca | 8 | 0.60% | |
| tu.gov.ab.ca | 6 | 0.45% | |
| Subtotal (Government) | 1,300 | 97.52% | |
| Total (Organization types) | 1,300 | 97.52% |
| Top 15 international organizations |
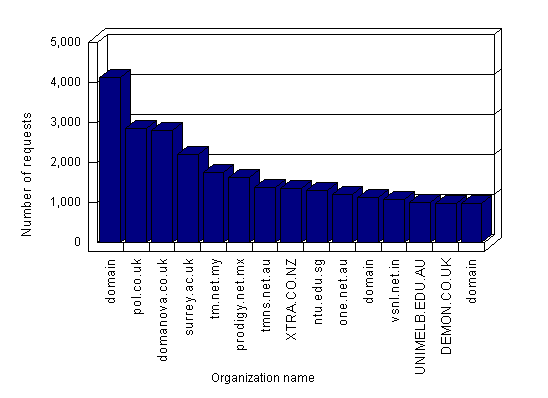 |
| Organization name | Number of requests | % of Int'l requests | |
| 1. | domain: rmit.edu.audescr: Royal Melbourne Institute of Tech | 4,129 | 3.71% |
| 2. | pol.co.uk | 2,836 | 2.55% |
| 3. | domanova.co.uk | 2,782 | 2.50% |
| 4. | surrey.ac.uk | 2,190 | 1.97% |
| 5. | tm.net.my | 1,753 | 1.58% |
| 6. | prodigy.net.mx | 1,620 | 1.46% |
| 7. | tmns.net.au | 1,380 | 1.24% |
| 8. | XTRA.CO.NZ | 1,348 | 1.21% |
| 9. | ntu.edu.sg | 1,292 | 1.16% |
| 10. | one.net.au | 1,190 | 1.07% |
| 11. | domain: scu.edu.audescr: Southern Cross Universitydescr: | 1,123 | 1.01% |
| 12. | vsnl.net.in | 1,076 | 0.97% |
| 13. | UNIMELB.EDU.AU | 986 | 0.89% |
| 14. | DEMON.CO.UK | 971 | 0.87% |
| 15. | domain: optusnet.com.audescr: Optus Administration Pty Ltdd | 970 | 0.87% |
| Total | 25,646 | 23.05% |
| Top 15 organizations for the top 10 international countries |
| Lists the top 10 international countries and the top 15 organizations visiting from each of these countries. Determine if your international marketing programs are attracting the expected numbers of visits. |
| Request summary |
| Top 10% of all requests |
| Lists the 10% of files that received the most requests. |
| Bottom 10% of all requests |
| Lists the 10% of files that received the fewest requests. |
| Top 10 requests by directory |
| Lists all top level directories by number of requests to files within that directory, then similarly lists the second and third directory levels branching from each top level directory. The top 10 files, based on number of requests, are displayed for each directory level. |
| Visit summary |
| Request patterns per visit |
| Shows the distribution of the top 10 values for "number of requests per visit" over the analysis period. If your goal is to engage users on your site, then you want more users with a larger number of requests per visit, i.e. the graph should be stacked to the right. |
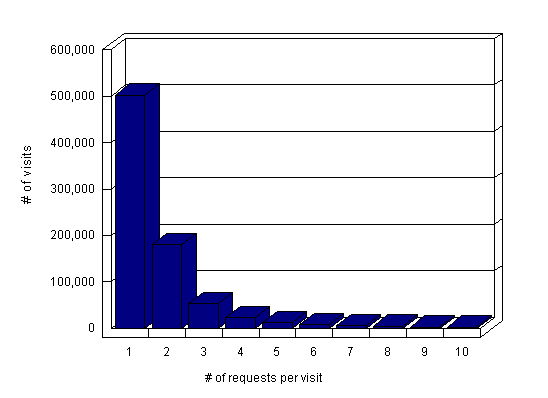 |
| # of requests per visit | # of visits | % of visits |
| 1 | 502,763 | 61.89% | 2 | 180,573 | 22.23% | 3 | 53,265 | 6.56% | 4 | 23,353 | 2.87% | 5 | 12,344 | 1.52% | 6 | 8,462 | 1.04% | 7 | 5,765 | 0.71% | 8 | 4,497 | 0.55% | 9 | 2,967 | 0.37% | 10 | 2,394 | 0.29% |
| Total | 796,383 | 98.04% |
| Top 10% of first requests |
| Lists the top first pages that users see when coming to your site. The data only reflects links from other sites or URLs entered by a user. |
| Top 10% of last requests |
| Lists the most frequently viewed files prior to a user exiting your site. |
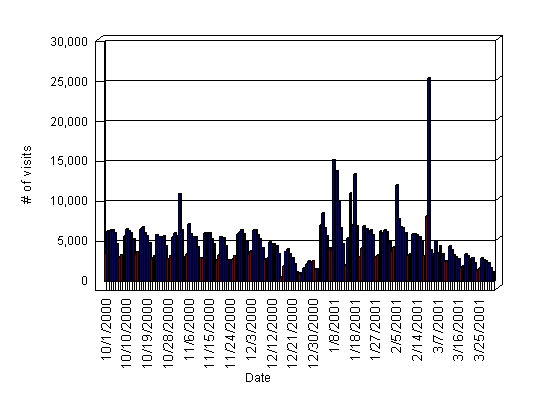
| Daily visit trends |
| Shows the number of visits for each day in the analysis period. Weekdays are shown as blue bars and weekends as red ones. |
 |
| Daily visit statistics |
| Average number of visits (all days) | 4,463.37 |
| % of visits (weekdays) | 83.24% |
| % of visits (weekends) | 16.76% |
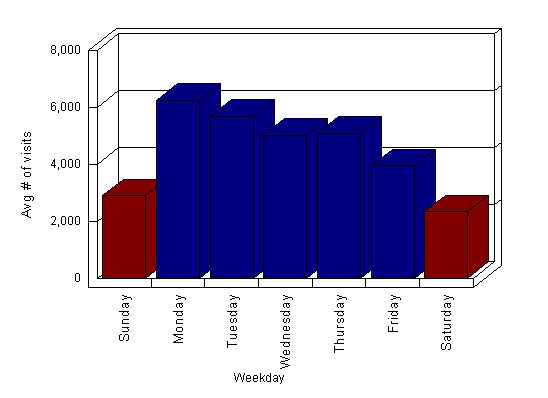
| Visits by day of week |
| Shows the average number of visits for each day of the week over the analysis period. |
 |
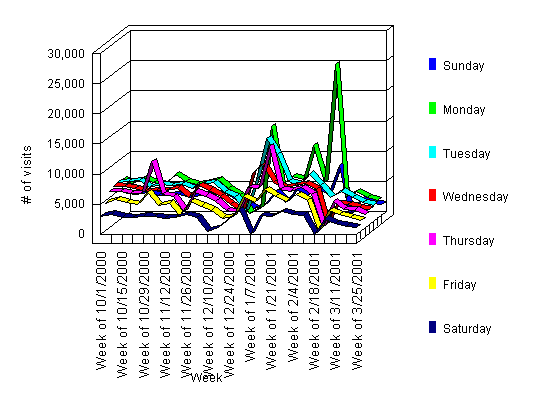
| Visits by day of week trends |
| Shows the how the visits per day of week vary over the weeks in the analysis period. |
 |
| Week | Weekday | |||||||
| Sunday | Monday | Tuesday | Wednesday | Thursday | Friday | Saturday | Total | |
| Week of 10/1/2000 | 3,476 | 6,286 | 6,414 | 6,356 | 6,030 | 4,624 | 3,034 | 36,220 | Week of 10/8/2000 | 3,306 | 5,634 | 6,524 | 6,304 | 6,042 | 5,214 | 3,326 | 36,350 | Week of 10/15/2000 | 3,678 | 6,486 | 6,726 | 5,982 | 5,698 | 4,738 | 2,858 | 36,166 | Week of 10/22/2000 | 3,186 | 5,810 | 5,576 | 5,480 | 5,608 | 4,422 | 2,798 | 32,880 | Week of 10/29/2000 | 3,200 | 5,518 | 6,030 | 5,620 | 10,928 | 6,340 | 3,008 | 40,644 | Week of 11/5/2000 | 3,416 | 7,126 | 5,954 | 5,570 | 5,508 | 4,272 | 2,920 | 34,766 | Week of 11/12/2000 | 2,884 | 5,986 | 6,016 | 6,020 | 5,208 | 4,632 | 2,660 | 33,406 | Week of 11/19/2000 | 3,234 | 5,574 | 5,384 | 4,430 | 2,668 | 2,630 | 2,782 | 26,702 | Week of 11/26/2000 | 3,184 | 5,862 | 6,132 | 6,444 | 5,932 | 4,926 | 3,314 | 35,794 | Week of 12/3/2000 | 3,788 | 6,356 | 6,454 | 5,720 | 5,238 | 4,108 | 2,744 | 34,408 | Week of 12/10/2000 | 2,846 | 4,874 | 4,694 | 4,678 | 4,414 | 3,450 | 508 | 25,464 | Week of 12/17/2000 | 1,910 | 3,690 | 3,982 | 3,340 | 2,898 | 2,132 | 1,094 | 19,046 | Week of 12/24/2000 | 964 | 728 | 1,580 | 2,152 | 2,464 | 2,380 | 2,566 | 12,834 | Week of 1/1/2001 | 1,488 | 1,559 | 6,970 | 8,540 | 6,688 | 5,654 | 4,124 | 35,023 | Week of 1/7/2001 | 3,796 | 15,182 | 13,718 | 10,012 | 6,592 | 4,686 | 0 | 53,986 | Week of 1/14/2001 | 1,998 | 5,396 | 11,028 | 6,974 | 13,418 | 6,892 | 3,074 | 48,780 | Week of 1/21/2001 | 4,098 | 6,836 | 6,578 | 6,030 | 6,368 | 5,756 | 2,976 | 38,642 | Week of 1/28/2001 | 3,228 | 6,294 | 6,000 | 6,412 | 6,084 | 4,846 | 3,718 | 36,582 | Week of 2/4/2001 | 4,286 | 12,028 | 7,790 | 6,816 | 6,610 | 6,073 | 3,243 | 46,846 | Week of 2/11/2001 | 3,363 | 5,897 | 5,922 | 5,777 | 5,507 | 5,068 | 3,174 | 34,708 | Week of 2/18/2001 | 8,106 | 25,411 | 3,851 | 0 | 0 | 0 | 0 | 37,368 | Week of 3/4/2001 | 0 | 3,345 | 4,979 | 3,465 | 4,368 | 3,391 | 2,522 | 22,070 | Week of 3/11/2001 | 2,489 | 4,343 | 3,888 | 3,285 | 2,977 | 2,730 | 1,772 | 21,484 | Week of 3/18/2001 | 1,918 | 3,360 | 3,094 | 2,730 | 2,923 | 2,206 | 1,374 | 17,605 | Week of 3/25/2001 | 1,619 | 2,845 | 2,643 | 2,484 | 2,203 | 1,677 | 1,077 | 14,548 |
| Avg | 3,018 | 6,497 | 5,917 | 5,225 | 5,295 | 4,114 | 2,427 | |
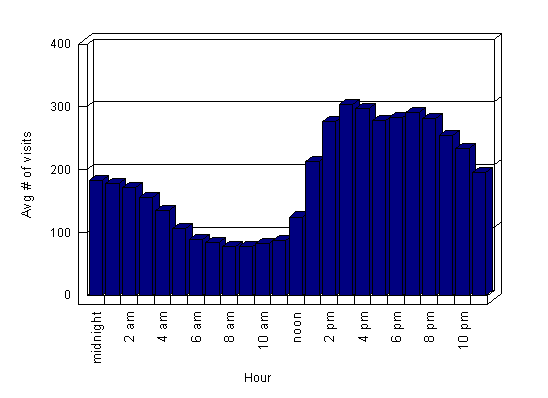
| Visits by hour of the day |
 |
| Hourly visit statistics |
| Average number of visits (all hours) | 185.97 |
| % of visits (work hours) | 39.03% |
| % of visits (nonwork hours) | 60.97% |
| Visits and requests by hour of the day |
| Shows for each hour of the day the average number of requests and visits plus the average number of requests per visit. |
| Hour | Avg # of requests | Avg # of visits | Avg requests per visit |
| midnight | 451.32 | 183.33 | 2.46 | 1 am | 409.87 | 178.40 | 2.30 | 2 am | 377.99 | 171.55 | 2.20 | 3 am | 346.47 | 155.49 | 2.23 | 4 am | 328.44 | 135.27 | 2.43 | 5 am | 298.93 | 106.32 | 2.81 | 6 am | 237.31 | 89.23 | 2.66 | 7 am | 221.72 | 83.44 | 2.66 | 8 am | 239.14 | 78.13 | 3.06 | 9 am | 212.10 | 77.64 | 2.73 | 10 am | 216.61 | 82.13 | 2.64 | 11 am | 222.29 | 87.08 | 2.55 | noon | 292.88 | 124.50 | 2.35 | 1 pm | 497.79 | 213.00 | 2.34 | 2 pm | 818.98 | 277.03 | 2.96 | 3 pm | 921.60 | 303.66 | 3.03 | 4 pm | 841.07 | 297.89 | 2.82 | 5 pm | 675.34 | 278.92 | 2.42 | 6 pm | 706.86 | 283.28 | 2.50 | 7 pm | 689.15 | 291.10 | 2.37 | 8 pm | 653.76 | 281.28 | 2.32 | 9 pm | 594.72 | 254.90 | 2.33 | 10 pm | 559.95 | 233.73 | 2.40 | 11 pm | 491.82 | 196.06 | 2.51 |
| Total | 11,306.10 | 4,463.37 |
| Referring organization summary |
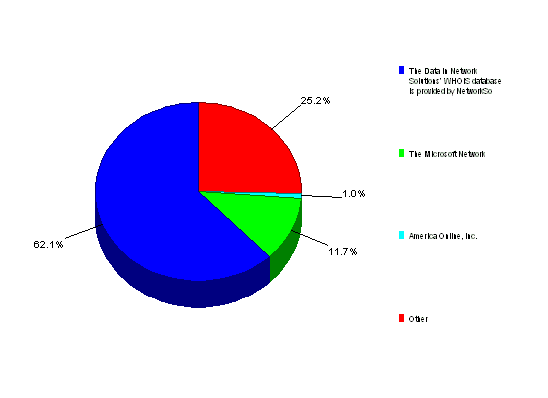
| Top 10 referring organizations |
| Referring organizations have pages on their site that link users to your site. This graph shows the top 10 organizations that users linked from to reach your site. |
 |
| Referrer organization name | # of visits | % of visits | Avg # of requests per visit | |
| 1. | The Data in Network Solutions' WHOIS database is provided by NetworkSo | 115,753 | 62.07% | 1.35 |
| 2. | The Microsoft Network | 21,788 | 11.68% | 1.36 |
| 3. | America Online, Inc. | 1,957 | 1.05% | 1.16 |
| Total | 139,498 | 74.80% |
| Top 10 referring URLs from the top 10 referring organizations |
| Breaks out the results from the above table over the most recent five weeks. This table shows the top 10 URLs from the top 10 referring organizations that drove traffic to your site. |
| Browser summary |
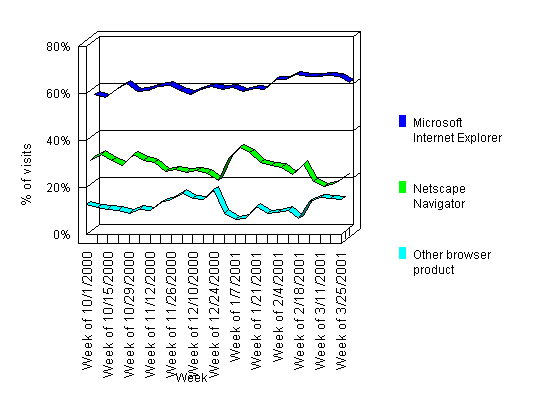
| Browser market share |
| Shows the percentage of visits to your site using Netscape and Microsoft browsers over the analysis period. |
 |
| Week | Browser product | ||
| Microsoft Internet Explorer | Netscape Navigator | Other browser product | |
| Week of 10/1/2000 | 56.81% | 30.29% | 12.89% | Week of 10/8/2000 | 55.49% | 32.95% | 11.55% | Week of 10/15/2000 | 58.86% | 30.23% | 10.91% | Week of 10/22/2000 | 61.37% | 28.20% | 10.43% | Week of 10/29/2000 | 58.25% | 32.57% | 9.18% | Week of 11/5/2000 | 58.74% | 30.39% | 10.87% | Week of 11/12/2000 | 60.30% | 29.35% | 10.35% | Week of 11/19/2000 | 60.88% | 25.38% | 13.74% | Week of 11/26/2000 | 58.59% | 26.40% | 15.01% | Week of 12/3/2000 | 57.04% | 25.28% | 17.68% | Week of 12/10/2000 | 58.84% | 25.79% | 15.37% | Week of 12/17/2000 | 60.15% | 24.82% | 15.03% | Week of 12/24/2000 | 59.23% | 21.47% | 19.29% | Week of 1/1/2001 | 59.97% | 30.84% | 9.19% | Week of 1/7/2001 | 58.02% | 35.55% | 6.44% | Week of 1/14/2001 | 59.26% | 33.68% | 7.06% | Week of 1/21/2001 | 58.99% | 29.21% | 11.80% | Week of 1/28/2001 | 63.24% | 27.90% | 8.86% | Week of 2/4/2001 | 63.34% | 27.38% | 9.28% | Week of 2/11/2001 | 65.40% | 24.13% | 10.47% | Week of 2/18/2001 | 64.66% | 28.62% | 6.72% | Week of 3/4/2001 | 64.63% | 21.32% | 14.05% | Week of 3/11/2001 | 65.01% | 19.10% | 15.90% | Week of 3/18/2001 | 64.54% | 20.20% | 15.26% | Week of 3/25/2001 | 61.87% | 23.20% | 14.93% |
| Avg | 60.54% | 27.37% | 12.09% |
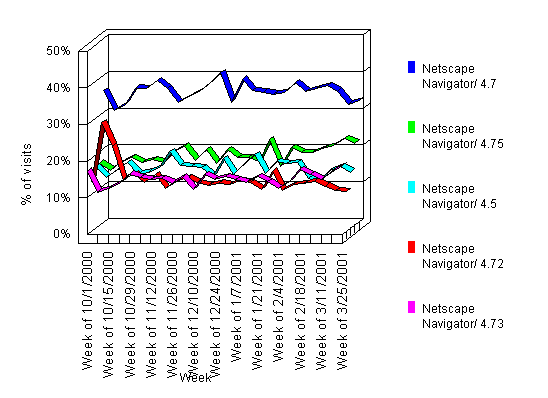
| Version trends |
| Shows the top 5 Netscape versions visiting your site over the weeks in the analysis period. |
 |
| Week | Browser product version | ||||
| Netscape Navigator/ 4.7 | Netscape Navigator/ 4.75 | Netscape Navigator/ 4.5 | Netscape Navigator/ 4.72 | Netscape Navigator/ 4.73 | |
| Week of 10/1/2000 | 35.72% | 16.78% | 16.65% | 13.55% | 17.30% | Week of 10/8/2000 | 30.17% | 14.89% | 13.69% | 29.68% | 11.57% | Week of 10/15/2000 | 32.00% | 16.83% | 15.60% | 23.17% | 12.41% | Week of 10/22/2000 | 36.37% | 18.19% | 17.75% | 13.70% | 13.99% | Week of 10/29/2000 | 36.26% | 17.00% | 14.65% | 15.66% | 16.43% | Week of 11/5/2000 | 38.35% | 17.73% | 15.18% | 13.24% | 15.50% | Week of 11/12/2000 | 36.22% | 16.98% | 16.42% | 15.38% | 15.00% | Week of 11/19/2000 | 32.36% | 19.97% | 20.87% | 11.64% | 15.15% | Week of 11/26/2000 | 33.98% | 21.45% | 16.99% | 13.57% | 14.01% | Week of 12/3/2000 | 35.45% | 17.58% | 16.76% | 14.57% | 15.64% | Week of 12/10/2000 | 37.83% | 20.39% | 16.43% | 13.20% | 12.14% | Week of 12/17/2000 | 40.49% | 16.78% | 14.01% | 12.39% | 16.32% | Week of 12/24/2000 | 32.54% | 20.53% | 18.85% | 13.13% | 14.94% | Week of 1/1/2001 | 38.81% | 18.26% | 14.65% | 12.61% | 15.67% | Week of 1/7/2001 | 35.75% | 18.22% | 17.44% | 13.69% | 14.90% | Week of 1/14/2001 | 35.23% | 17.33% | 19.98% | 13.31% | 14.15% | Week of 1/21/2001 | 34.68% | 23.22% | 14.96% | 11.39% | 15.75% | Week of 1/28/2001 | 35.18% | 15.84% | 18.16% | 16.41% | 14.41% | Week of 2/4/2001 | 37.93% | 20.92% | 17.52% | 11.22% | 12.41% | Week of 2/11/2001 | 35.38% | 19.74% | 17.80% | 12.74% | 14.33% | Week of 2/18/2001 | 36.24% | 19.66% | 13.41% | 13.02% | 17.68% | Week of 3/4/2001 | 37.00% | 20.73% | 12.35% | 13.65% | 16.27% | Week of 3/11/2001 | 35.55% | 21.56% | 15.65% | 12.27% | 14.96% | Week of 3/18/2001 | 31.95% | 23.40% | 16.67% | 10.98% | 17.00% | Week of 3/25/2001 | 32.86% | 22.27% | 15.24% | 10.76% | 18.87% |
| Avg | 35.37% | 19.05% | 16.31% | 14.20% | 15.07% |
| Security support |
| Shows the level of security found in the Netscape browsers visiting your site. |
| Browser security | # of visits | % of visits | |
| 1. | Exportable SSL (40 bit RC4 encryption) | 209,649 | 90.64% |
| 2. | U.S. domestic SSL (128 bit RC4 encryption) | 21,641 | 9.36% |
| Total | 231,290 | 100.00% |
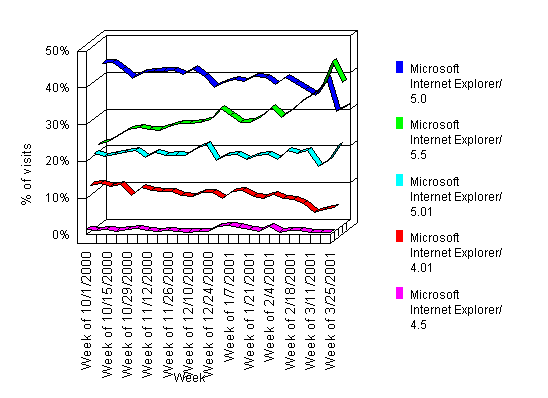
| Version trends |
| Shows the top 5 Microsoft versions visiting your site over the weeks in the analysis period. |
 |
| Week | Browser product version | ||||
| Microsoft Internet Explorer/ 5.0 | Microsoft Internet Explorer/ 5.5 | Microsoft Internet Explorer/ 5.01 | Microsoft Internet Explorer/ 4.01 | Microsoft Internet Explorer/ 4.5 | |
| Week of 10/1/2000 | 43.39% | 22.11% | 20.40% | 12.69% | 1.42% | Week of 10/8/2000 | 43.43% | 22.80% | 19.54% | 13.08% | 1.14% | Week of 10/15/2000 | 41.65% | 24.57% | 20.24% | 12.17% | 1.37% | Week of 10/22/2000 | 39.28% | 26.01% | 20.77% | 12.95% | 1.00% | Week of 10/29/2000 | 40.81% | 26.76% | 21.22% | 9.85% | 1.37% | Week of 11/5/2000 | 41.05% | 26.05% | 19.36% | 11.94% | 1.60% | Week of 11/12/2000 | 41.20% | 25.97% | 20.65% | 11.08% | 1.10% | Week of 11/19/2000 | 41.27% | 26.93% | 19.98% | 10.89% | 0.93% | Week of 11/26/2000 | 40.23% | 27.66% | 20.02% | 10.87% | 1.23% | Week of 12/3/2000 | 41.73% | 27.70% | 19.80% | 9.83% | 0.93% | Week of 12/10/2000 | 39.82% | 28.09% | 21.70% | 9.66% | 0.73% | Week of 12/17/2000 | 36.85% | 28.72% | 22.80% | 10.70% | 0.93% | Week of 12/24/2000 | 38.15% | 31.78% | 18.56% | 10.65% | 0.87% | Week of 1/1/2001 | 38.90% | 29.98% | 19.78% | 9.06% | 2.28% | Week of 1/7/2001 | 38.42% | 28.03% | 20.05% | 10.88% | 2.61% | Week of 1/14/2001 | 39.76% | 28.15% | 18.75% | 11.23% | 2.11% | Week of 1/21/2001 | 39.38% | 29.76% | 19.81% | 9.66% | 1.39% | Week of 1/28/2001 | 37.62% | 32.09% | 20.12% | 9.17% | 1.01% | Week of 2/4/2001 | 39.44% | 29.52% | 18.76% | 10.04% | 2.25% | Week of 2/11/2001 | 37.77% | 31.29% | 21.20% | 9.00% | 0.75% | Week of 2/18/2001 | 36.13% | 33.71% | 20.37% | 8.63% | 1.16% | Week of 3/4/2001 | 34.52% | 35.46% | 21.31% | 7.53% | 1.17% | Week of 3/11/2001 | 39.13% | 38.11% | 16.99% | 5.17% | 0.60% | Week of 3/18/2001 | 30.23% | 44.63% | 18.48% | 6.10% | 0.56% | Week of 3/25/2001 | 31.45% | 38.85% | 22.62% | 6.53% | 0.55% |
| Avg | 38.86% | 29.79% | 20.13% | 9.97% | 1.24% |
| Security support |
| Shows the level of security found in the Microsoft browsers visiting your site. |
| Browser security | # of visits | % of visits | |
| 1. | Exportable SSL (40 bit RC4 encryption) | 489,638 | 100.00% |
| Total | 489,638 | 100.00% |
| Top 3 browser categories by all operating systems |
| Shows the type of operating systems used with Netscape, Microsoft, and "other" browsers. |
| Operating system | Browser product | ||
| Microsoft Internet Explorer | Netscape Navigator | Other browser product | |
| Windows (32 bit) | 95.04% | 77.84% | 34.76% | Unknown operating system | 0.02% | 3.20% | 63.09% | Macintosh (PowerPC) | 4.60% | 15.69% | 1.65% | UNIX - Linux | 0.00% | 2.19% | 0.00% | Windows (16 bit) | 0.33% | 0.13% | 0.49% | UNIX - Sun | 0.00% | 0.45% | 0.00% | Macintosh (68k) | 0.01% | 0.40% | 0.02% | UNIX - SGI | 0.00% | 0.03% | 0.00% | UNIX - HP | 0.00% | 0.02% | 0.00% | UNIX - DEC | 0.00% | 0.02% | 0.00% | UNIX - IBM | 0.00% | 0.02% | 0.00% |
| Bandwidth summary |
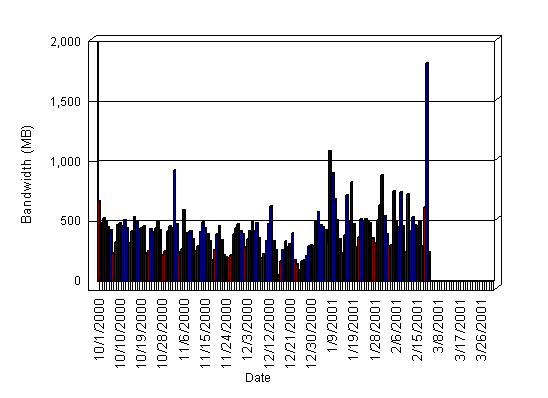
| Daily bandwidth trends |
| Shows the bytes transferred for each day in the analysis period. Check for unusually low or high readings for a particular day of the week. Abnormally low readings could signal a connection problem to your site. Weekdays are shown as blue bars and weekends as red bars. |
 |
| Daily bandwidth statistics |
| Total bandwidth (MB) | 59,868.88 |
| Average bandwidth (MB) (all days) | 328.95 |
| % of bandwidth (weekdays) | 80.80% |
| % of bandwidth (weekends) | 19.20% |
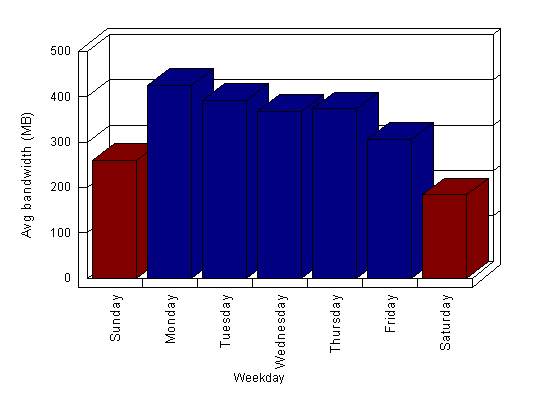
| Bandwidth by day of week |
| Shows the average capacity requirements for each day of the week. Understand the best day to perform maintenance or upgrade your site. |
 |
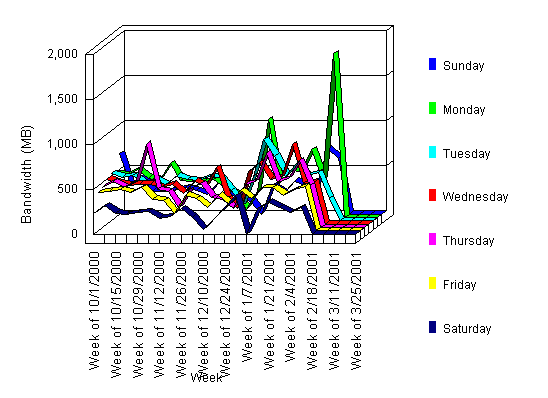
| Bandwidth by day of week trends |
| Shows the variation in bandwidth (MB) per day of week over the weeks in the analysis period. |
 |
| Week | Weekday | |||||||
| Sunday | Monday | Tuesday | Wednesday | Thursday | Friday | Saturday | Total | |
| Week of 10/1/2000 | 673.27 | 484.11 | 522.98 | 501.82 | 448.78 | 424.89 | 232.27 | 3,288.11 | Week of 10/8/2000 | 328.39 | 470.48 | 487.08 | 457.26 | 512.34 | 442.83 | 315.30 | 3,013.69 | Week of 10/15/2000 | 418.11 | 532.20 | 500.91 | 432.96 | 445.76 | 458.67 | 235.16 | 3,023.77 | Week of 10/22/2000 | 254.11 | 438.27 | 409.48 | 445.21 | 496.90 | 426.72 | 219.66 | 2,690.33 | Week of 10/29/2000 | 247.13 | 415.67 | 458.02 | 444.12 | 927.21 | 477.22 | 240.24 | 3,209.60 | Week of 11/5/2000 | 263.92 | 596.38 | 405.12 | 407.44 | 422.54 | 351.34 | 250.25 | 2,696.99 | Week of 11/12/2000 | 291.97 | 412.00 | 494.23 | 446.47 | 396.11 | 335.75 | 177.65 | 2,554.17 | Week of 11/19/2000 | 261.86 | 394.64 | 458.43 | 339.40 | 219.74 | 197.68 | 196.29 | 2,068.04 | Week of 11/26/2000 | 217.66 | 393.55 | 444.55 | 476.00 | 417.54 | 397.51 | 282.59 | 2,629.40 | Week of 12/3/2000 | 350.70 | 421.51 | 491.19 | 415.96 | 487.55 | 356.62 | 190.35 | 2,713.87 | Week of 12/10/2000 | 230.20 | 336.98 | 480.99 | 625.26 | 332.51 | 263.46 | 50.27 | 2,319.67 | Week of 12/17/2000 | 169.44 | 262.18 | 333.40 | 280.91 | 312.30 | 397.99 | 178.11 | 1,934.33 | Week of 12/24/2000 | 144.19 | 92.38 | 165.47 | 174.81 | 213.43 | 292.85 | 298.13 | 1,381.26 | Week of 1/1/2001 | < 0.01 | 292.69 | 497.28 | 581.24 | 471.50 | 450.63 | 430.26 | 2,723.60 | Week of 1/7/2001 | 318.08 | 1,089.69 | 899.93 | 683.02 | 508.79 | 355.73 | < 0.01 | 3,855.24 | Week of 1/14/2001 | 230.75 | 382.25 | 716.61 | 500.20 | 827.27 | 479.20 | 287.64 | 3,423.92 | Week of 1/21/2001 | 366.39 | 520.19 | 497.88 | 521.39 | 505.07 | 482.69 | 356.38 | 3,249.99 | Week of 1/28/2001 | 314.03 | 508.63 | 631.86 | 882.55 | 541.62 | 395.66 | 295.19 | 3,569.54 | Week of 2/4/2001 | 303.82 | 751.12 | 502.68 | 447.77 | 740.88 | 460.51 | 240.29 | 3,447.08 | Week of 2/11/2001 | 724.17 | 422.37 | 532.63 | 465.37 | 464.17 | 496.16 | 292.22 | 3,397.08 | Week of 2/18/2001 | 615.47 | 1,820.30 | 243.42 | < 0.01 | < 0.01 | < 0.01 | < 0.01 | 2,679.19 | Week of 3/4/2001 | < 0.01 | < 0.01 | < 0.01 | < 0.01 | < 0.01 | < 0.01 | < 0.01 | < 0.01 | Week of 3/11/2001 | < 0.01 | < 0.01 | < 0.01 | < 0.01 | < 0.01 | < 0.01 | < 0.01 | < 0.01 | Week of 3/18/2001 | < 0.01 | < 0.01 | < 0.01 | < 0.01 | < 0.01 | < 0.01 | < 0.01 | < 0.01 | Week of 3/25/2001 | < 0.01 | < 0.01 | < 0.01 | < 0.01 | < 0.01 | < 0.01 | < 0.01 | < 0.01 |
| Avg | 268.95 | 441.50 | 406.97 | 381.17 | 387.68 | 317.76 | 190.73 | |
| Hourly bandwidth statistics |
| Total bandwidth (MB) | 59,868.88 |
| Average bandwidth (MB) (all hours) | 13.71 |
| % of bandwidth (work hours) | 40.25% |
| % of bandwidth (nonwork hours) | 59.75% |
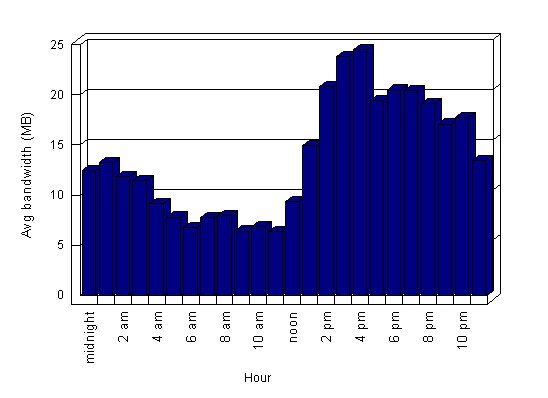
| Bandwidth by hour of the day |
| Shows the average bandwidth (MB) for each hour of the day and the percentage of total bytes transferred per day during each hour. Use this information to plan maintenance or upgrades for non-peak hours. |
 |
| Hour | Avg bandwidth (MB) | % of bandwidth |
| midnight | 12.41 | 3.77% | 1 am | 13.22 | 4.02% | 2 am | 11.82 | 3.59% | 3 am | 11.43 | 3.47% | 4 am | 9.14 | 2.78% | 5 am | 7.79 | 2.37% | 6 am | 6.78 | 2.06% | 7 am | 7.76 | 2.36% | 8 am | 7.96 | 2.42% | 9 am | 6.40 | 1.95% | 10 am | 6.84 | 2.08% | 11 am | 6.33 | 1.92% | noon | 9.36 | 2.85% | 1 pm | 14.94 | 4.54% | 2 pm | 20.82 | 6.33% | 3 pm | 23.79 | 7.23% | 4 pm | 24.49 | 7.44% | 5 pm | 19.43 | 5.91% | 6 pm | 20.45 | 6.22% | 7 pm | 20.43 | 6.21% | 8 pm | 19.09 | 5.80% | 9 pm | 17.08 | 5.19% | 10 pm | 17.72 | 5.39% | 11 pm | 13.47 | 4.09% |
| Avg | 13.71 | 4.17% |